
Preface
This article has a strong personal flavor; if it makes you uncomfortable, please close it right away. This article is only for personal study notes. You’re welcome to repost or share it within the scope of the license agreement, but please respect the copyright and keep the original link. Thank you for your understanding and cooperation. If you find this site helpful, you can subscribe via RSS. Thanks for the support!
Recently I’ve been a bit lazy. Every time Xcode starts, it logs an error in lldb saying it can’t find some python file. To get to the bottom of it, I spent some time and simply fixed it.
What is Chisel?
If I answered this question wrong, iOS developers would laugh at me to death. This tool has been open-sourced by Facebook for a long time. I’d studied it before, but when I changed computers I was too lazy to set up the environment. I never took it seriously. These past few days I ran into a console problem during development, happened to see it, and thought I’d organize it.
First, the tool’s address is https://github.com/facebook/chisel
Here’s the installation method it provides:
1
2
brew update
brew install chisel
Just install it via brew.
Then it tells you to look for a hidden file .lldbinit in your home directory, and create it if it doesn’t exist.
1
2
3
touch .lldbinit
open .lldbinit
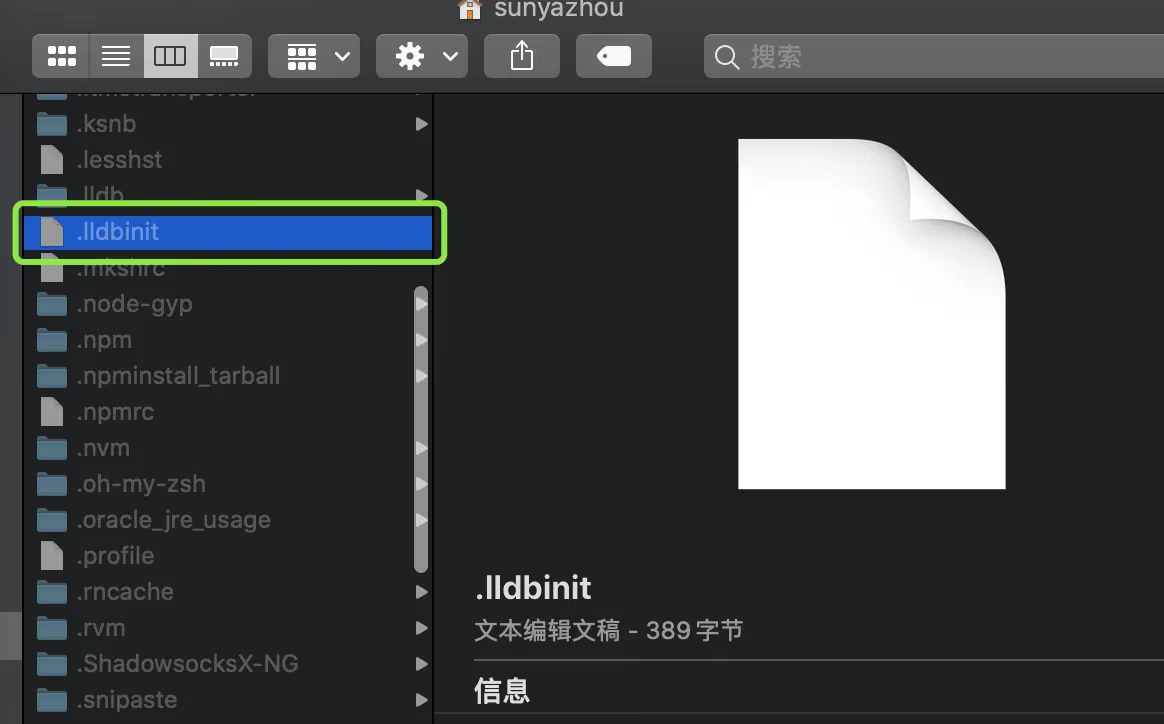
After creating it, put the script command in. I won’t show the official way here — it’s like crap and doesn’t work well at all.
Let me show my approach.
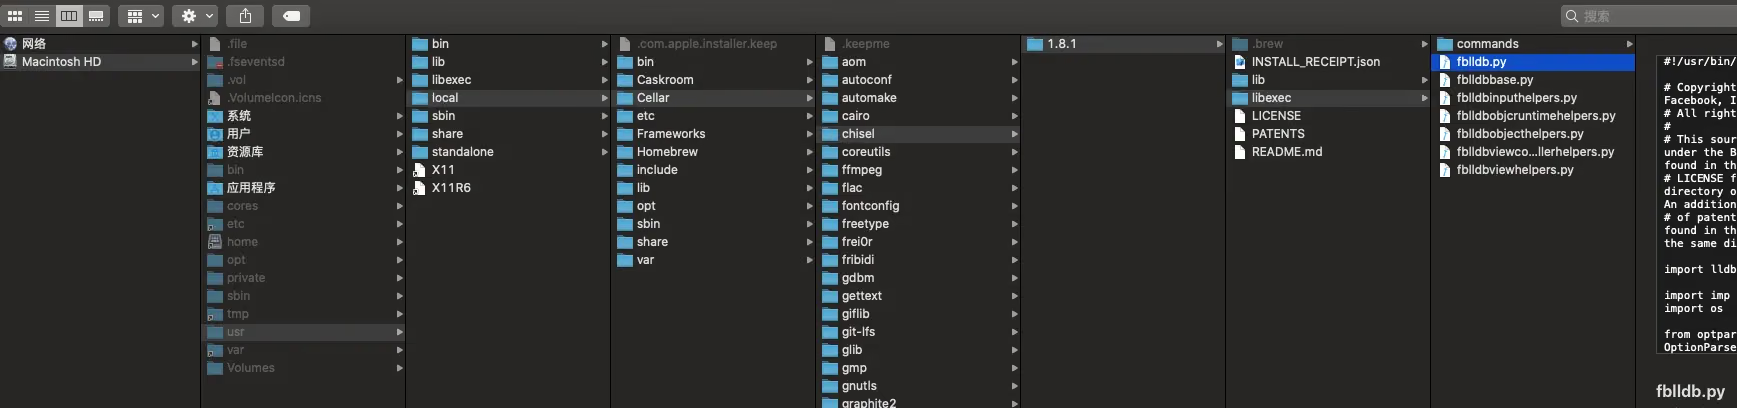
This is the path diagram after I installed it on my local machine.
1
2
3
### Chisel LLDB add by sunyazhou
command script import /usr/local/Cellar/chisel/1.8.1/libexec/fblldb.py
Add the code above to the local .lldbinit file — make sure the path matches. Then restart Xcode and run; you can use it in the console without any issues.
Since this file can be modified by Reveal, various lldb tools often modify this file.
1
2
3
4
5
6
7
8
9
10
11
12
### Chisel LLDB add by sunyazhou
command script import /usr/local/Cellar/chisel/1.8.1/libexec/fblldb.py
###

### LLDB https://github.com/DerekSelander/LLDB
command script import /Users/sunyazhou/LLDB-master/lldb_commands/dslldb.py
###

### Reveal LLDB commands support - DO NOT MODIFY
command script import /Users/sunyazhou/Library/Application\ Support/Reveal/RevealServerCommands.py
###
Chisel Usage
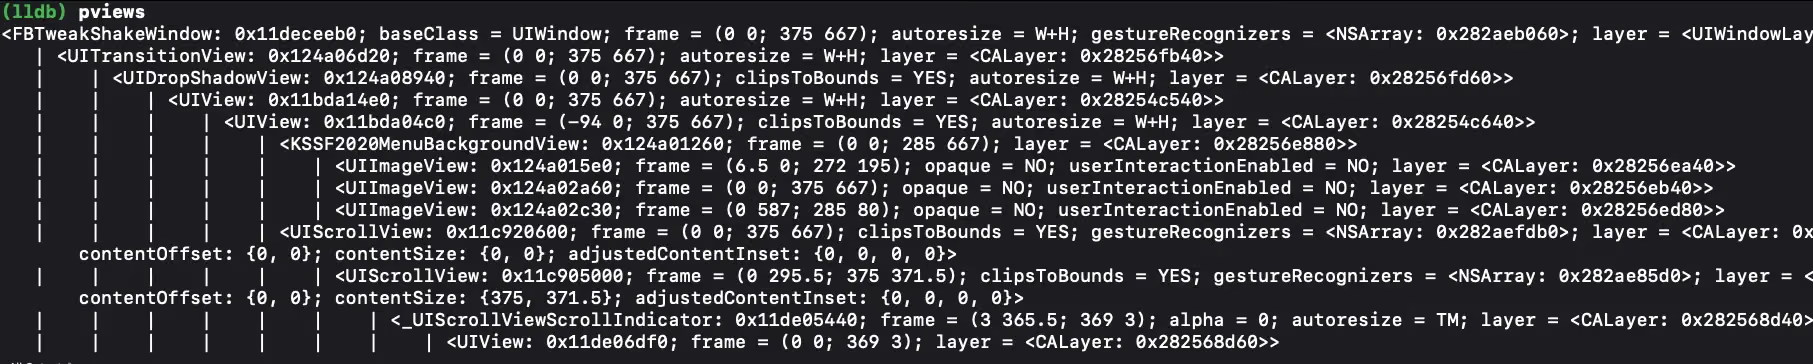
pvc: view the current controller’s statepviews: view the UIWindow and its subview hierarchypresponder: print an object’s responder chainpclass: print related info based on a memory addressvisualize: use macOS’s Preview program to view UIImage, CGImage, UIView, CALayer, NSData (of a UIImage), UIColor, CIColor.show/hide: show or hide a UIViewmask/umask: add a semi-transparent mask to a UIView or CALayerborder/unborder: add or remove a border on a specified UIView or CALayer for debugging. Remember to runcaflushright after.caflush: refresh the UI, similar to the flush mentioned earlierbmessage: add a breakpoint even if the function isn’t implemented in the subclass (for example, if you want to set a breakpoint in viewWillAppear in UIViewController but the parent method may not be implemented, you can add it viabmessage [UIViewController viewWillAppear:])wivar: works like KVO, observing a variable, e.g.wivar self _subviewstaplog: enable tap logging — when you tap a control, it prints the control’s infopaltrace: print the auto-layout info of a specified view, e.g.paltrace self.viewptv: print the UITableView in the current view; similarlypcellsprints the UITableViewCell(s) in the current viewpdata: string decode of Datavs: search for a specified view and add a semi-transparent mask (with subcommands), e.g.vs 0x13a9efe00marks the corresponding controlslowanim/unslowanim: slow down (or cancel) animation speed, default 0.1. You can runslowanimat any breakpoint or when Xcode pauses, which is handy for animation debugging
Demo effect
What other lldb debugging tools are there?
lldb_commands is another third-party lldb extension library that provides many practical file operations.
ls: list the directory or files at a specified path pexecutable: print the location of the current executable dumpenv: view environment info, e.g. the sandbox path yoink: copy files from a specified directory to the mac’s temp directory keychain: view keychain info
Summary
If you want to do a good job, first sharpen your tools. As an iOS developer, if you want to reach the highest level, you need to try all the good tools — that’s how you continuously improve your productivity.