
Preface
Recently I was developing a live-streaming app, and I found that once CPU usage maxed out, the CPU downclocked, overheating got severe, and then came the stutter…
To pinpoint this problem, we spent at least 3 days tracing the thread code that was consuming CPU, step by step. When we hit C++ threads, there was no symbol table — all we could see was a blob of object addresses, not even a method name. We were completely at a loss. This post introduces an advanced debugging method that uses the symbol table and related instructions to trace the code calls. It’s not the best-written piece, so I hope the masters will go easy on me. Special thanks to my colleague Chen Hao for his strong support with the code process.
Talk is cheap show me the code
Our approach is to find the base address of the dynamic library and start from there, using the relevant instructions to recover the call chain.
Preparation
- Enable the symbol table (dSYM) in build settings.

1. Import the Header File
1
#import <mach-o/dyld.h>
This is the header for macOS’s dynamic linker for executable files. It contains several built-in functions we need.
2. Copy the Code Below to Where You Want to Use It
1
2
3
4
5
6
7
8
9
10
11
12
13
14
//1
uint32_t count = _dyld_image_count();
DDLogInfo(@"Dyld image count %d", count);
//2
for (int i = 0; i < count; i++) {
    char *image_name = (char *)_dyld_get_image_name(i);
    //3
    const struct mach_header *mh = _dyld_get_image_header(i);
    intptr_t vmaddr_slide = _dyld_get_image_vmaddr_slide(i);
    //4
    NSLog(@"Image name %s at address 0x%llx and ASLR slide 0x%lx.\n",
              image_name, (mach_vm_address_t)mh, vmaddr_slide);
}
Let me explain the code above.
- Get the number of current images.
- Iterate through the images.
- Get the base address of each image.
- Print the info.
Then run your program.
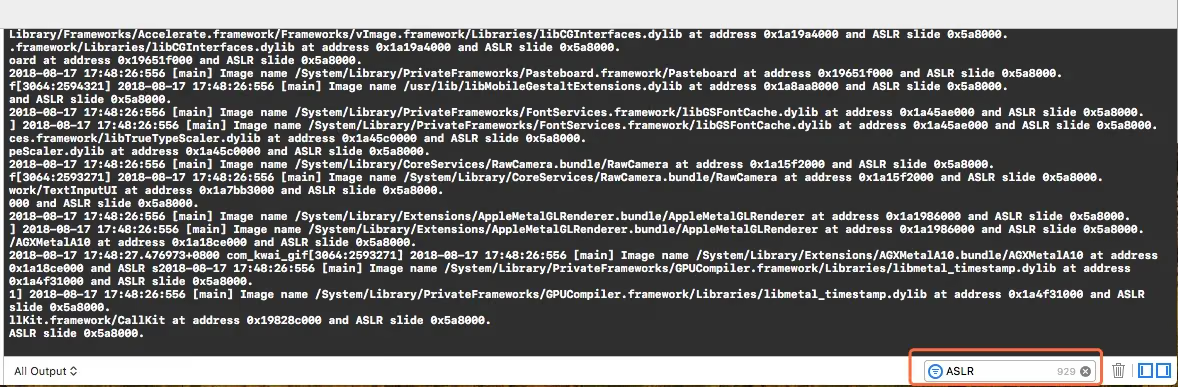
Then check the console and filter our log entries by ASLR.
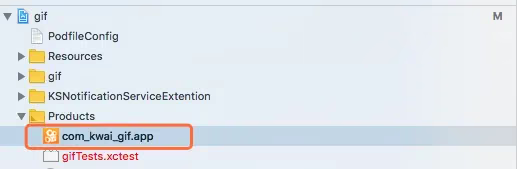
Then click Product in the Xcode project.
Right-click and choose “Show in Finder”.
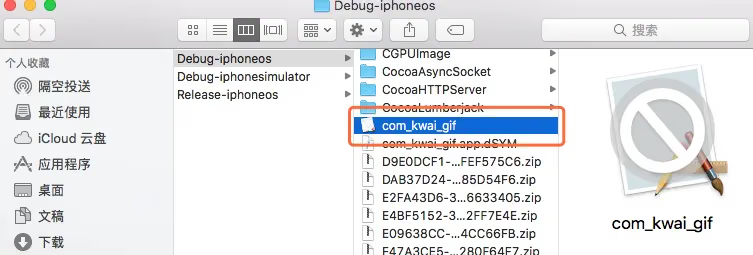
Next, open Terminal, cd to that directory (you can open Terminal, type cd + space, then drag the folder in).

Then run pwd to check.
3. Search the Console for Our Log Output
Find the first base address.
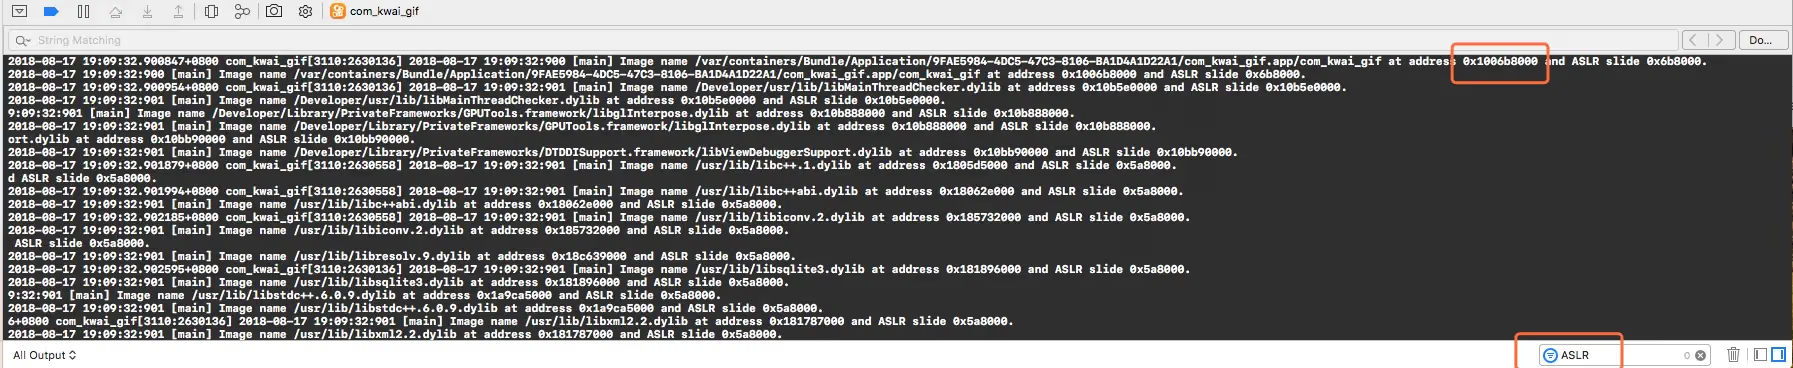
Note: this step is very important. If it doesn’t work, try again a few times.
Grab the base address of main from the ASLR log and copy it, then paste it into the terminal
1
atos -arch arm64 -o com_kwai_gif.app.dSYM/Contents/Resources/DWARF/com_kwai_gif -l  0x1006b8000
Note: this is the symbol table path. If you don’t know where to find it, google it.
Let’s test whether it works.
First, click the button at the top of the console panel.

Then type bt in the console.

If you see the following, it means you’ve succeeded.

4. Run on a Real Device and Find the Unknown Threads
First, click Profile in the Xcode project to run instruments. In my case, after running the project, Xcode 9.4 can seamlessly switch to instruments.

We find a relevant thread — no name, we don’t even know what the object is, just a hex address.
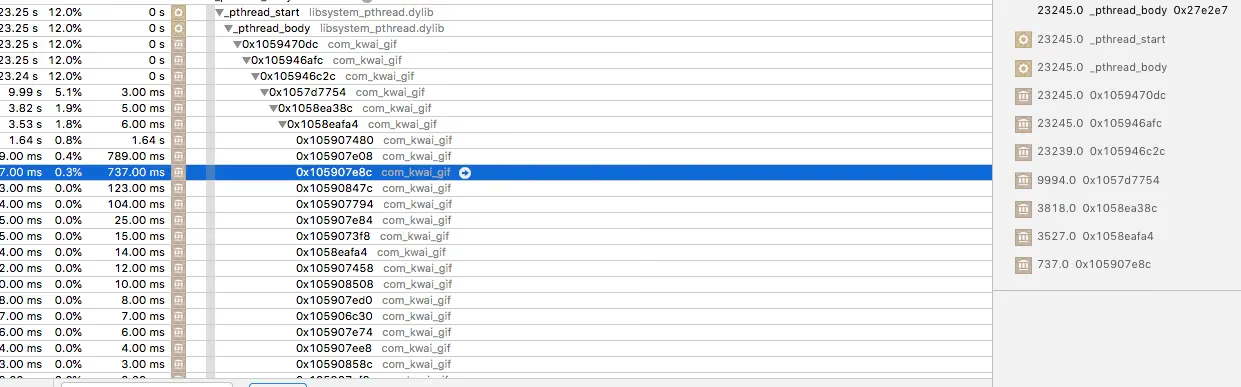
Pick an arbitrary address and type it in the terminal.

OK. If you run into problems, delete the product and the symbol table and recompile.
Summary
The CPU debugging process is quite painful, and most of the intermediate code is C++ calls — the main overhead comes from thread consumption. There’s a lot to learn from it, and I hope you’ll share your feedback.
The End