
Preface
This post carries strong personal sentiment; if you feel uncomfortable reading it, please close it as soon as possible. This post is only a personal learning record. Reposting or sharing within the license terms is welcome; please respect copyright and keep the original link. Thank you for your understanding and cooperation. If you find this site helpful, you can subscribe via RSS. Thanks for your support!
OOM
In iOS development, you may often see apps crash while in use, but when you look at the crash stack in the background, you can’t find a crash log. In most cases this is likely a low-memory crash by the system, i.e. OOM (another possibility is that the main thread froze, causing the watchdog to kill the app). Logs for low-memory crashes usually start with JetsamEvent, and contain fields such as memory page size (pageSize) and CPU time (cpuTime).
What is OOM?
What is OOM? It’s the abbreviation of out-of-memory, literally meaning memory exceeded the limit. It’s a special kind of Crash caused by iOS’s Jetsam mechanism. Unlike regular Crashes, the OOM event cannot be captured by crash monitoring solutions such as Signal capture.
Of course, there are also terms like FOOM, which stands for Foreground-out-of-memory — the App is forcibly killed by the system because it consumes too much memory in the foreground. That’s what this post is about. An OOM in the background isn’t necessarily caused by the app itself; in most cases, the foreground app is occupying too much memory, and the system cleans up background apps to ensure the foreground app runs normally.
What is the Jetsam mechanism?
The Jetsam mechanism can be understood as a management mechanism the operating system adopts to control excessive memory resource usage. Jetsam is an independently running process; every process has a memory threshold, and once that threshold is exceeded, Jetsam immediately kills the process.
Why design the Jetsam mechanism?
First, a device’s memory is limited — it’s not infinite — so memory resources are very important. System processes and processes of other apps used by the user all compete for this resource. Since iOS doesn’t support swap space, once a low-memory event is triggered, Jetsam releases as much memory occupied by apps as possible. In this way, when the system runs out of memory on iOS, apps get terminated by the system.
Swap space
What do we do when physical memory isn’t enough? Some desktop operating systems have memory swap space, called virtual memory on Windows. Its mechanism is to swap part of the physical memory to the hard disk when needed, using disk space to expand memory.
iOS doesn’t support swap space
But iOS doesn’t support swap space, and neither do most mobile devices. The mass storage on mobile devices is usually flash memory, whose read/write speeds are far slower than the hard disks used by computers. As a result, even if swap space were used on a mobile device, it wouldn’t improve performance. Second, mobile device storage capacity itself is often in short supply, and the read/write lifespan of memory is limited, so using flash as memory swap under these conditions would be a bit of a luxury.
Note that a few articles online say iOS has no virtual memory mechanism; in fact, they mean iOS has no swap space mechanism.
Typical app memory types
When memory is insufficient, the system follows certain policies to free up more space for use. A common practice is to move part of the lower-priority data to disk; this operation is called Page Out. Later, when this data is accessed again, the system moves it back into memory; this operation is called Page In.
Clean Memory
Clean Memory refers to memory that can be Page Out‘d — read-only memory-mapped files, or the frameworks used by the App. Each framework has a _DATA_CONST segment; they’re usually Clean, but if you do runtime swizzling, they become Dirty.
Dirty Memory
Dirty Memory refers to memory that has been written to by the App, including all heap objects and image decoding buffers; similarly to Clean memory, it also includes the frameworks used by the App. Each framework has a _DATA segment and a _DATA_DIRTY segment, and their memory is Dirty.
It’s worth noting that using frameworks during app execution produces Dirty Memory. Using singletons or global initializer methods is a good way to reduce Dirty Memory, because a singleton, once created, is never destroyed, and global initializer methods run when the class is loaded.
Compressed Memory
Due to the limits of flash storage capacity and read/write lifespan, iOS has no swap space mechanism; it uses Compressed memory instead.
Compressed memory compresses recently used memory to below half its original size when memory is tight, and can decompress and reuse it when needed. It saves memory while improving system responsiveness. In short:
- Shrinks memory usage — reduces inactive memory usage
- Improves power efficiency — reduces the wear caused by disk I/O through compression
- Minimizes CPU usage — compression/decompression is very fast, minimizing CPU time overhead
- Is multicore aware — supports multi-core operations
For example, when we use Dictionary to cache data, suppose 3 pages of memory are currently in use; when it’s not accessed, it might be compressed to 1 page, and when used again, it decompresses back to 3 pages.
Essentially,
Compressed memoryis alsoDirty memory. Therefore,memory footprint=dirty size+compressed size— this is the memory usage we need and can try to reduce.
Memory Warning
I believe MemoryWarning is no stranger to you; every UIViewController has a didReceivedMemoryWarning method.
When memory usage rises bit by bit rather than instantly blowing through memory, the system sends memory warnings to all running apps before the critical memory point is reached, telling them to clean up their own memory. And memory warnings aren’t always caused by your own app.
Memory compression technology makes releasing memory complicated. It’s implemented at the operating system level and is invisible to processes. Interestingly, if the current process receives a memory warning and is about to release a large amount of misused memory, and it touches too much compressed memory, then decompressing that memory can actually increase memory pressure further, leading to an OOM and being killed by the system.
The purpose of caching data is to reduce CPU pressure, but too much caching also occupies too much memory. In scenarios that require caching data, consider using
NSCacheinstead ofNSDictionary; the memory allocated byNSCacheis actuallyPurgeable Memory, which the system can release automatically. The bookEffective Objective-C 2.0also recommends combiningNSCachewithNSPurgeableData: it lets the system reclaim memory as conditions require, and also removes related objects when memory is cleaned up.
Does Memory Warning always occur before an OOM?
The answer is not necessarily. It’s possible to request a huge amount of memory all at once, and if the main thread happens to be busy with other things at that moment, the OOM can occur without ever experiencing a Memory Warning. Of course, even after multiple Memory Warnings, an OOM doesn’t necessarily occur within a few seconds after the last Memory Warning. When I was developing extensions before, Memory Warnings would often appear without an OOM; only after another minute or two of operations would the OOM occur, and during that minute or two, no more Memory Warnings appeared.
Of course, handling memory when a warning arrives can, to some extent, avoid an OOM.
How to determine the OOM threshold?
Different devices have different OOM thresholds. So how do we know the OOM threshold?
Method 1
When our App is killed by the Jetsam mechanism, a system log is generated on the phone. In the phone’s Settings - Privacy - Analytics, you can find logs starting with JetSamEvent. These logs contain some memory information about the App. For example, on my current iPhone 12, I can see pageSize in the early part of the log, and by finding the per-process-limit entry (not all logs have it; you can find one that does), you can get the OOM threshold by computing rpages * pageSize.
1
2
3
4
5
6
7
8
9
10
11
12
13
14
15
16
17
18
19
20
21
22
23
24
25
26
27
28
29
30
31
32
33
34
35
36
37
38
39
40
41
42
43
44
45
46
47
48
49
50
51
52
53
54
55
56
57
58
59
{"bug_type":"298","timestamp":"2022-07-10 01:18:15.51 +0800","os_version":"iPhone OS 15.5 (19F77)","incident_id":"893A5949-F274-434F-938F-96DF562C9486"}
{
  "crashReporterKey" : "1fccb167681199b571738b0f60a42574dace79ac",
  "kernel" : "Darwin Kernel Version 21.5.0: Thu Apr 21 21:51:27 PDT 2022; root:xnu-8020.122.1~1\/RELEASE_ARM64_T8101",
  "product" : "iPhone13,2",
  "incident" : "893A5949-F274-434F-938F-96DF562C9486",
  "date" : "2022-07-10 01:18:15.51 +0800",
  "build" : "iPhone OS 15.5 (19F77)",
  "timeDelta" : 5,
  "memoryStatus" : {
  "compressorSize" : 55911,
  "compressions" : 121377965,
  "decompressions" : 84151972,
  "zoneMapCap" : 1394786304,
  "largestZone" : "APFS_4K_OBJS",
  "largestZoneSize" : 41566208,
  "pageSize" : 16384,
  "uncompressed" : 139405,
  "zoneMapSize" : 242122752,
  "memoryPages" : {
    "active" : 55880,
    "throttled" : 0,
    "fileBacked" : 47550,
    "wired" : 51160,
    "anonymous" : 63802,
    "purgeable" : 489,
    "inactive" : 52901,
    "free" : 8686,
    "speculative" : 2571
  }
},
  "largestProcess" : "WeChat",
  "genCounter" : 0,
  "processes" : [
  {
    "uuid" : "c5bfd6df-d788-3dd4-a585-3ad5aa26b390",
    "states" : [
      "daemon",
      "idle"
    ],
    "purgeable" : 0,
    "age" : 111572686953,
    "fds" : 25,
    "coalition" : 3457,
    "rpages" : 84,
    "priority" : 0,
    "physicalPages" : {
      "internal" : [
        3,
        68
      ]
    },
    "freeze_skip_reason:" : "out-of-budget",
    "pid" : 85307,
    "cpuTime" : 0.007986,
    "name" : "EnforcementService",
    "lifetimeMax" : 87
  }
...
So the memory threshold of this MemoryTest is pageSize * rpages / 1024 / 1024 = xx MB.
Method 2
When DEBUGGING via Xcode, if the memory used exceeds the limit, the system throws the EXC_RESOURCE_EXCEPTION exception.
Method 3
First, we can get the memory currently used by the app via a method.
Then determine by probing the system’s available memory.
For the relevant code, please search other web platforms — they’ll be more comprehensive than here.
Method 4 (applicable to iOS 13 systems)
iOS 13’s os/proc.h provides a new API to check the currently available memory.
1
2
3
4
5
6
7
8
#import <os/proc.h>
extern size_t os_proc_available_memory(void);
+ (CGFloat)availableSizeOfMemory {
    if (@available(iOS 13.0, *)) {
        return os_proc_available_memory() / 1024.0 / 1024.0;
    }
    // ...
}
Exploring the concrete implementation of Jetsam in the source code
The kernels of iOS/macOS are both XNU, and XNU is open source. We can find it in the open source XNU kernel source code.
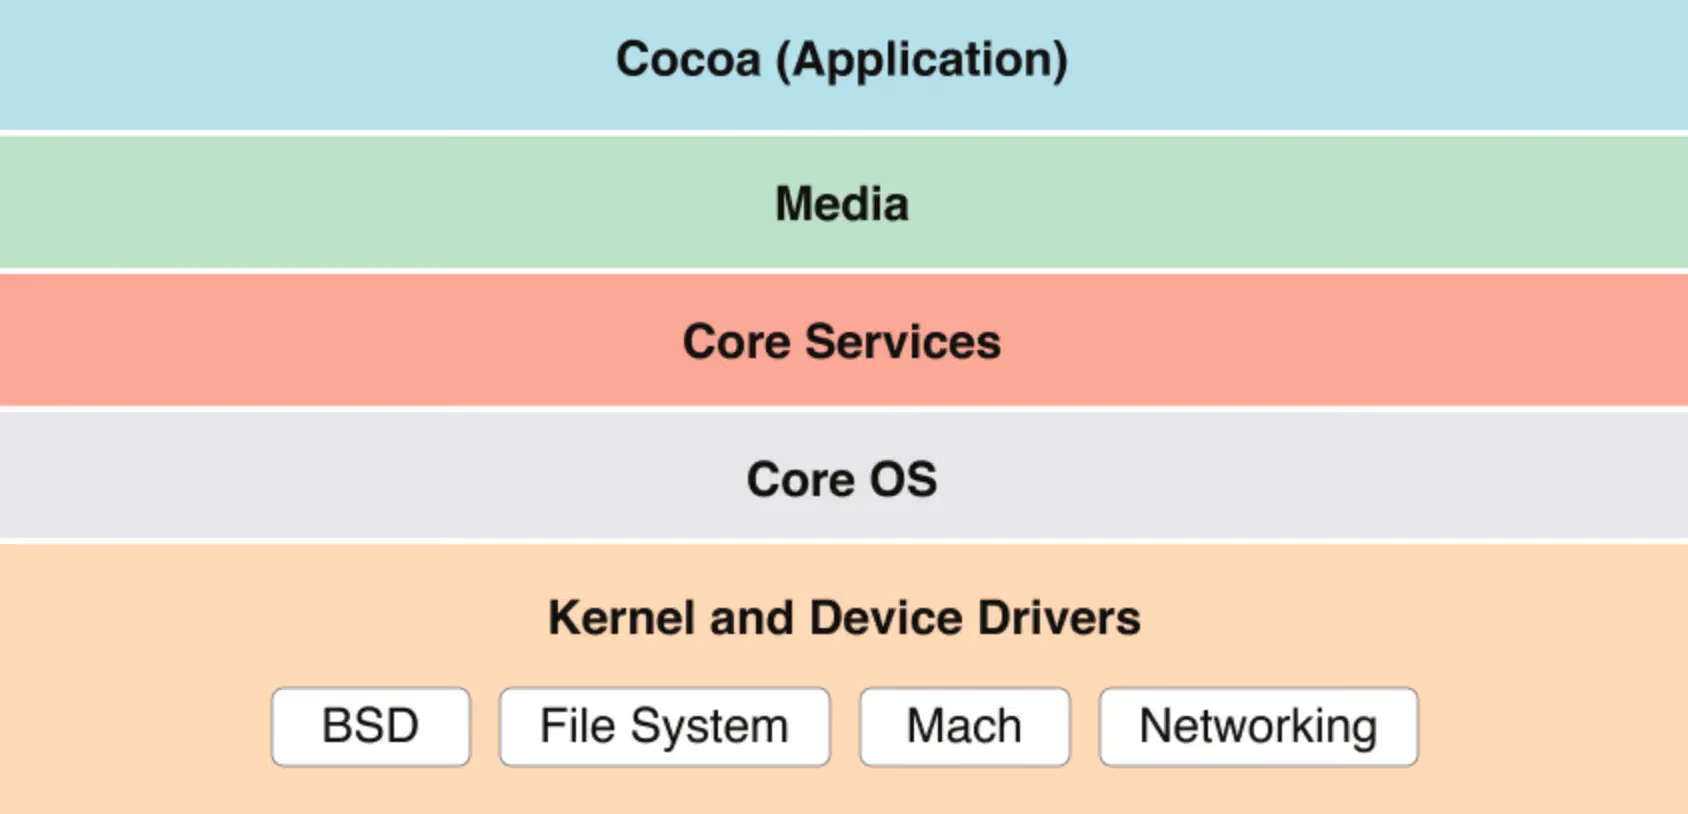
The inner layer of the XNU kernel is the Mach layer. As a microkernel, Mach is a thin layer providing only basic services, such as processor management, scheduling, and IPC (inter-process communication). The second major part of XNU is the BSD layer. We can think of it as an outer ring around the Mach layer; BSD provides programming interfaces to end-user applications, and its responsibilities include process management, file systems, and networking.
The various common Jetsam events in memory management are also produced by BSD, so let’s start from the bsd_init function as an entry point to explore the principles.
bsd_init is mostly about initializing various subsystems, such as virtual memory management.
BSD initialization bsd_init
The memory-related steps include the following:
1
2
3
4
5
6
7
8
9
10
11
12
13
14
15
16
17
//1. Initialize the BSD memory Zone; this Zone is based on the Mach kernel's zone
kmeminit();

//2. A feature unique to iOS — the resident monitoring thread for memory and process hibernation
#if CONFIG_FREEZE
#ifndef CONFIG_MEMORYSTATUS
    #error "CONFIG_FREEZE defined without matching CONFIG_MEMORYSTATUS"
#endif
	/* Initialise background freezing */
	bsd_init_kprintf("calling memorystatus_freeze_init\n");
	memorystatus_freeze_init();
#endif

//3. Unique to iOS — JetSAM (i.e. the resident monitoring thread for low-memory events)
#if CONFIG_MEMORYSTATUS
	/* Initialize kernel memory status notifications */
rticle/details/104004692
Both memorystatus_freeze_init() and memorystatus_init() mentioned here call the interfaces exposed in kern_memorystatus.c; their main purpose is to start two highest-priority threads in the kernel to monitor the entire system’s memory status.
The feature CONFIG_FREEZE involves: when this macro is enabled, the kernel freezes processes instead of Killing them. The code related to process hibernation is outside the scope of this post.
Back to the topic of OOM crashes on iOS, we only need to focus on the memorystatus_init() method.
Knowledge point introduction
In the kernel, all processes have a priority distribution maintained by an array, where each entry of the array is a list of processes. The size of this array is
JETSAM_PRIORITY_MAX + 1.1 2 3 4 5 6 7
#define MEMSTAT_BUCKET_COUNT (JETSAM_PRIORITY_MAX + 1) typedef struct memstat_bucket { TAILQ_HEAD(, proc) list; // A TAILQ_HEAD doubly linked list that stores the processes under this priority int count; // the number of processes } memstat_bucket_t; memstat_bucket_t memstat_bucket[MEMSTAT_BUCKET_COUNT];//priority queue (contains structures for different priorities)
In
kern_memorystatus.h, we can find the value ofJETSAM_PRIORITY_MAXand the definitions related to process priorities:1 2 3 4 5 6 7 8 9 10 11 12 13 14 15 16 17 18 19 20 21 22 23 24 25 26 27 28 29
#define JETSAM_PRIORITY_REVISION 2 #define JETSAM_PRIORITY_IDLE_HEAD -2 /* The value -1 is an alias to JETSAM_PRIORITY_DEFAULT */ #define JETSAM_PRIORITY_IDLE 0 #define JETSAM_PRIORITY_IDLE_DEFERRED 1 /* Keeping this around till all xnu_quick_tests can be moved away from it.*/ #define JETSAM_PRIORITY_AGING_BAND1 JETSAM_PRIORITY_IDLE_DEFERRED #define JETSAM_PRIORITY_BACKGROUND_OPPORTUNISTIC 2 #define JETSAM_PRIORITY_AGING_BAND2 JETSAM_PRIORITY_BACKGROUND_OPPORTUNISTIC #define JETSAM_PRIORITY_BACKGROUND 3 #define JETSAM_PRIORITY_ELEVATED_INACTIVE JETSAM_PRIORITY_BACKGROUND #define JETSAM_PRIORITY_MAIL 4 #define JETSAM_PRIORITY_PHONE 5 #define JETSAM_PRIORITY_UI_SUPPORT 8 #define JETSAM_PRIORITY_FOREGROUND_SUPPORT 9 #define JETSAM_PRIORITY_FOREGROUND 10 #define JETSAM_PRIORITY_AUDIO_AND_ACCESSORY 12 #define JETSAM_PRIORITY_CONDUCTOR 13 #define JETSAM_PRIORITY_HOME 16 #define JETSAM_PRIORITY_EXECUTIVE 17 #define JETSAM_PRIORITY_IMPORTANT 18 #define JETSAM_PRIORITY_CRITICAL 19 #define JETSAM_PRIORITY_MAX 21 /* TODO - tune. This should probably be lower priority */ #define JETSAM_PRIORITY_DEFAULT 18 #define JETSAM_PRIORITY_TELEPHONY 19
Among these, the larger the value, the higher the priority. The background app priority JETSAM_PRIORITY_BACKGROUND is 3, lower than the foreground app priority JETSAM_PRIORITY_FOREGROUND of 10, while SpringBoard (the home screen program) sits at JETSAM_PRIORITY_HOME 16.
- Reasons for JetSam to fire
1
2
3
4
5
6
7
8
9
10
11
12
13
14
#define JETSAM_REASON_INVALID								0
#define JETSAM_REASON_GENERIC								1
#define JETSAM_REASON_MEMORY_HIGHWATER						2
#define JETSAM_REASON_VNODE									3
#define JETSAM_REASON_MEMORY_VMPAGESHORTAGE					4
#define JETSAM_REASON_MEMORY_PROCTHRASHING					5
#define JETSAM_REASON_MEMORY_FCTHRASHING					6
#define JETSAM_REASON_MEMORY_PERPROCESSLIMIT				7
#define JETSAM_REASON_MEMORY_DISK_SPACE_SHORTAGE			8
#define JETSAM_REASON_MEMORY_IDLE_EXIT						9
#define JETSAM_REASON_ZONE_MAP_EXHAUSTION					10
#define JETSAM_REASON_MEMORY_VMCOMPRESSOR_THRASHING			11
#define JETSAM_REASON_MEMORY_VMCOMPRESSOR_SPACE_SHORTAGE	12
Source code logic flow
- The JetSam thread finishes initialization and receives memory pressure from the outside.
- If the received memory pressure means the current physical memory has hit its limit, an OOM of the per-process-limit type is synchronously triggered, and the flow exits.
- If the received memory pressure is of other types, wake up the
JetSamthread; when it determines thatkill_under_pressure_causeiskMemorystatusKilledVMThrashing,kMemorystatusKilledFCThrashing,kMemorystatusKilledZoneMapExhaustion, or when the currently available memorymemorystatus_available_pagesis less than the thresholdmemorystatus_available_pages_pressure, enter theOOMlogic. - Iterate over each process with the lowest priority; based on
phys_footprint, determine whether the current process exceeds the threshold. If none exceeds the threshold, keep looking at the next lowest-priority process until one is found, then trigger ahigh-watertypeOOM. - At this point, first reclaim a lower-priority process, or a process that can be reclaimed at any time under normal circumstances, then go back to step
4’s logic. - When all low-priority processes or processes that can normally be reclaimed at any time have been killed, if
memorystatus_available_pagesis still below the threshold, first kill background processes; after each process is killed, check whethermemorystatus_available_pagesis still below the threshold. If it’s already below the threshold, suspend the thread and wait to be woken up. - When all background processes have been killed, call
memorystatus_kill_top_process_aggressiveto kill foreground processes, then suspend the thread and wait to be woken up. - If the above
memorystatus_kill_top_process_aggressivedidn’t kill any process, kill the first process in theJetsamqueue via LRU, then suspend the thread and wait to be woken up.
How to determine that an OOM occurred
Both Facebook and WeChat’s Matrix use the exclusion method. During Matrix initialization, the checkRebootType method is called to determine whether an OOM occurred. Here’s the specific flow:
- If the current device is being DEBUGGED, return directly and don’t continue.
- Whether a normal crash occurred the last time the app was opened; if not, continue.
- After the app was last opened, whether the user actively quit the app (by listening to the
UIApplicationWillTerminateNotificationmessage); if not, continue. - After the app was last opened, whether
exit-related functions were called (monitored via theatexitfunction); if not, continue. - After the app was last opened, whether the app was
suspended or performedbackgroundFetch; if it wasn’t killed by the watchdog at this point, it’s anOOM, which Matrix callsSuspend OOM; if not, continue. - Whether the app’s uuid changed; if not, continue.
- After the app was last opened, whether the system was upgraded; if not, continue.
- After the app was last opened, whether the device rebooted; if not, continue.
- When the app was last opened, whether the app was in the background; if so, a
Background OOMwas triggered; if not, continue. - After the app was last opened, whether the app was in the foreground and whether the main thread froze; if it didn’t freeze, a
Foreground OOMwas triggered.
Summary
Most of what we usually discuss is FOOM, because if our program is in the background with a very low priority, even if we don’t occupy much memory, the foreground app occupying a lot of memory can still get our background program killed. That’s a system mechanism over which we don’t have much control. For FOOM, we need to focus on dirty pages and IOKit mappings, and of course pay attention to system caches such as images and fonts. For monitoring and solving OOM problems, refer to the two open source libraries Matrix and OOMDetector.
Practical solution: How Kuaishou’s Kuaijian (Kuaishou app) iOS reduced the OOM rate by 80%+